Research / Technology
Mapping what every consumer audience actually wears
We set out to build one thing: a standing map of what real consumer communities wear, and from that, what they are about to want. Not a trend report. Infrastructure that any brand, and eventually any agent, can query. This is where that work stands, what it already shows, and why we are doing it.
Published 11 August 2026. A progress report, not a launch. Every figure comes from a real run, and where a number is soft we say so.
The map
Garments, joined to the people who wear them
This is the shape of what we build: one real node from the New York map and its neighbourhood.
No invented edges: every connection here is real. The white sneakers sit on 7 accounts; the same people wear the crew tee, the jeans, the shorts and the leggings, and their neighbours carry it further, down to a woven leather bag on 4 accounts. Yellow-framed tiles are exact products the identification layer can name. Click one to see the product itself. Portraits are illustrations that link to the real accounts, and clicking any garment opens its evidence: the judged cluster plus its nearest neighbours, found by vector search over all 9,146 garment crops and checked by eye.
01 / The goal
One map, per audience, of what people wear
For any audience a brand cares about, whether a city, an age band or a competitor's customers, we build three things. A truly representative sample, reached by chain referral through people's real connections instead of hashtags. A garment-level understanding of what they wear: every piece cut out of real posts, matched across the people who wear it, resolved to exact products and colours. And on top of that map, our own machine-learning models that simulate the audience, so you can ask what they will want next before the market shows you.
Not a trend forecast, not social listening. The measurement layer underneath both. Everything below is a layer we built, with the evidence one click away.
02 / How it works
Four layers, built in order, each one measured
Four steps: reach real people, detect their garments, cluster them into distinct items, resolve items to products. Each step has a number and the evidence sits right below.
Reaching actually representative people
We reach real locals the way no search bar can: chain referral, the method survey science uses for populations nobody can list. Start from confirmed members, move through their real connections, validate every account on how it speaks rather than what it posts about. The result is the rarest thing in social data: a sample that behaves like a sample, almost free of the platform's bias toward whoever performs loudest.
Read moreRead less
The formal name is respondent-driven sampling, and survey science reaches hidden populations with it: people no register has ever listed, who can only be found through each other. Our version starts from a small set of confirmed New Yorkers, reads the comment sections under their posts to find the next wave, and repeats. Every candidate is scored on two surfaces at once, how the account writes and what its thumbnails look like, and is admitted if either clears the bar. Each account we keep carries its own paper trail: which wave it arrived in, which account referred it, how close it sat to the centre of the audience we were aiming at. New York took 876 accounts and 4,464 posts.
The literature also comes with estimators that correct for the bias chain referral introduces, because a referral chain over-samples the well connected. We have not finished implementing those, and that is the honest state of this layer. What the method already buys is a sample drawn through real social ties instead of through a ranking algorithm, which is a different and far more correctable starting error than search gives you. Search returns whoever performs the city best. This returns whoever is actually in it, plus a bias we can name and eventually correct for.
Turning a frame into garments on a person
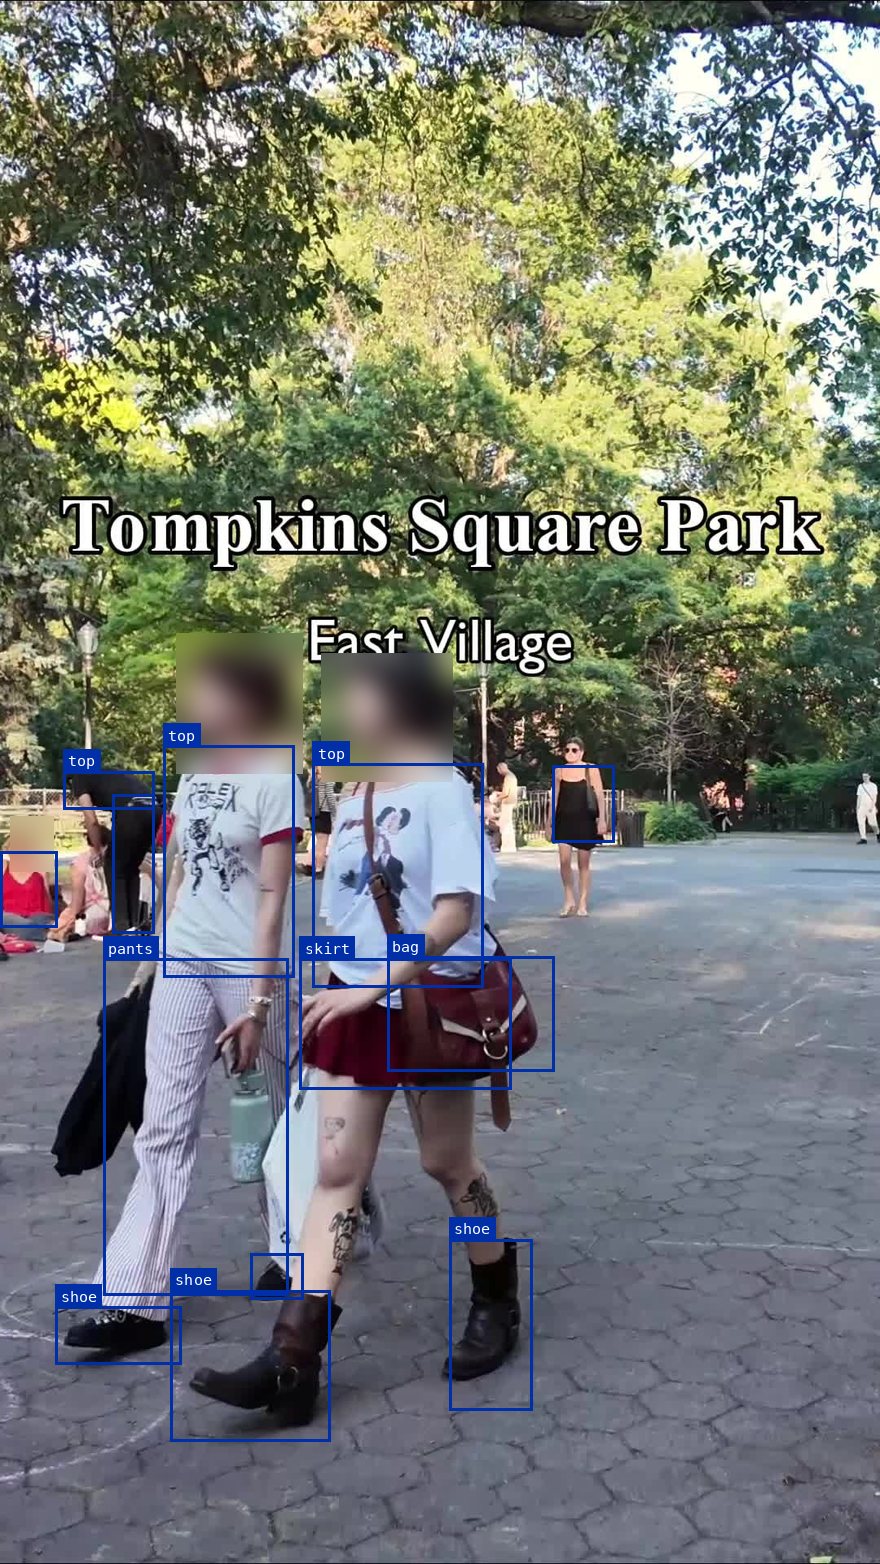
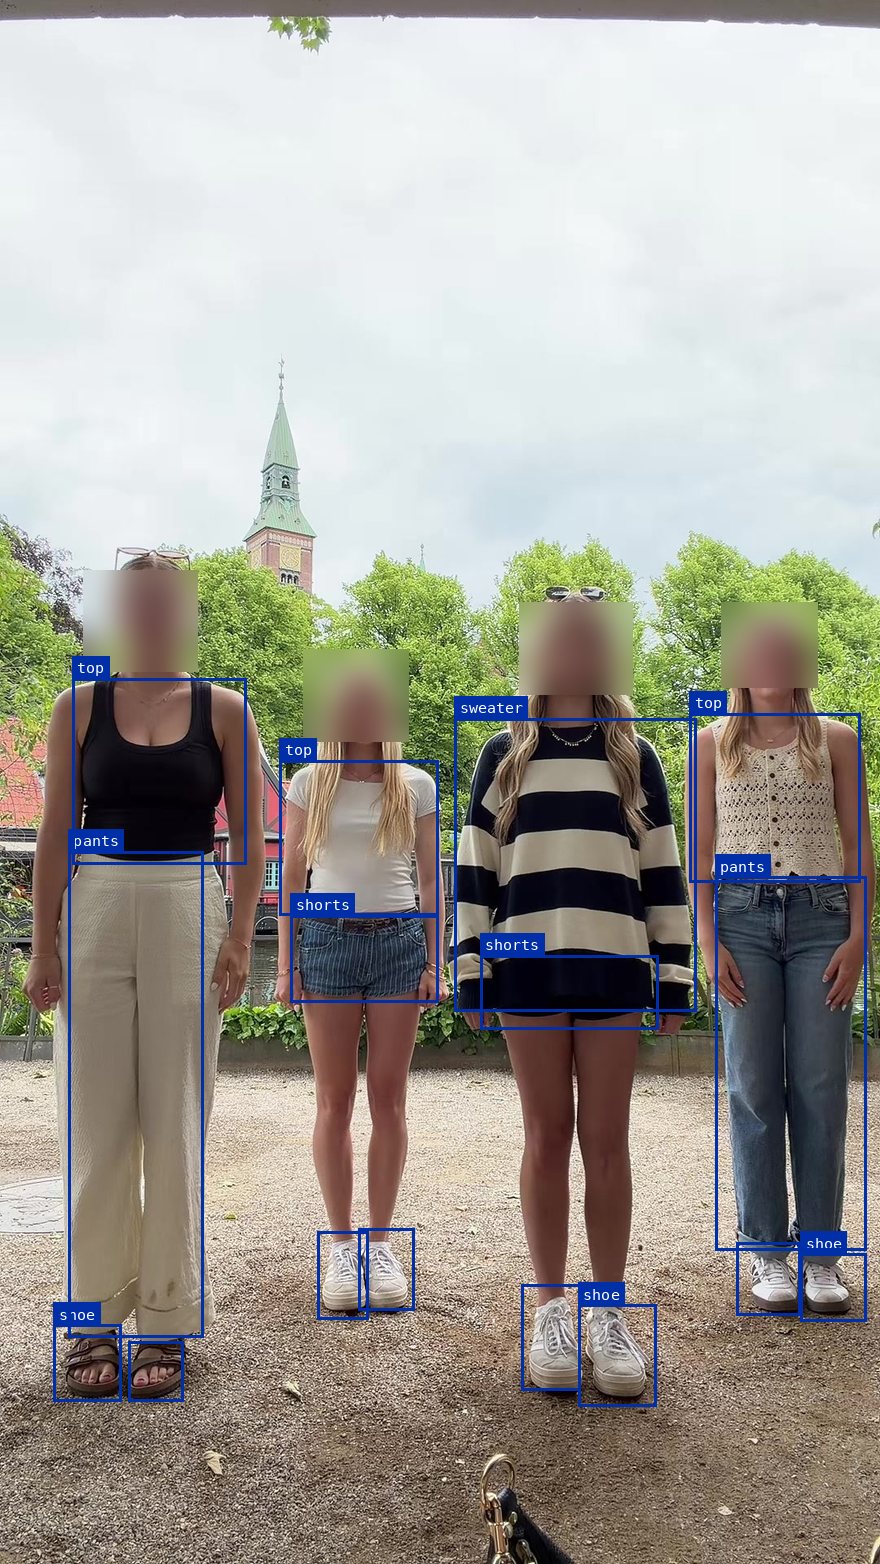
Every post becomes frames, and every visible piece of clothing gets found and cut out, on the main subject, on friends, on strangers in the background. Nobody has to post an outfit for us to read one. The frames below show exactly what that looks like.
Read moreRead less
The detector is a YOLO model we fine-tuned ourselves, trained on a hand-labelled set plus a multi-teacher pipeline that generates labels at volume. On our own benchmark it scores F1 0.597, and a smaller two-teacher variant lifted shoe recall from 0.21 to 0.80, footwear being the category most general-purpose detectors quietly drop. Both beat Gemini flash-lite at the same task. A person pass runs first, so clothing is found on bodies rather than anywhere in the frame, and when a single garment comes back detected as several pieces we union the fragments rather than discard them.
The real constraint on this layer is not the model, it is pixels. 81% of our crops came from 300 by 400 thumbnails with a median short side of 94 pixels, and no detector recovers detail the platform never transmitted. We now re-fetch origin-resolution covers where they exist, which gives a median 3.6 times more short side to work with. Detection error is also the largest single source of bad nodes further down: when we started judging whole clusters instead of pairs, 23% held the wrong category, and 57% of those were entire clusters of the wrong object. That is this layer failing, not the clustering.
Making the vector describe the clothes
Every cropped garment becomes a vector, and vector search finds it again on other people: the same piece, recognised across the whole city, across different lighting, different cameras and different bodies. That is how a single pair of jeans becomes a node with ten people attached to it.
Read moreRead less
The first version of this layer had a quiet, fatal flaw: the vectors keyed on the photograph rather than the garment. A shirt and a pair of trousers cropped from the same photo scored 0.680 cosine similarity, while two different shirts from two different photos scored 0.643. The photo was beating the clothing. Fixing it needed no new model. Cut the crop at the raw detector box with no padding, subtract 0.3 of the frame's own embedding, and photo bias falls from 0.672 to 0.428 while pair accuracy rises to 0.959. We held Paris out of the derivation entirely to check we had not tuned to New York, and every measure improved there too.
Going greyscale and partitioning on garment type instead of colour then took item separation from 0.469 to 0.762, which made the expensive masking step we had planned redundant before we built it. Then we changed the ruler and the picture got worse: judged as whole clusters rather than as pairs, the shipped graph is 37.6% usable nodes and only 11.7% exactly one product. One further result is worth stating plainly. Requiring three near-duplicates before a garment becomes a node removes 18% of crops, and it removes them unevenly, with dresses retained at 56.8% against sunglasses at 95.5%. A dress nobody else in New York owns cannot find two twins. A plain white tee always can, so the map under-reports exactly the garments that make a wardrobe distinctive.
Resolving a garment to a product on sale
Where a garment is distinctive enough, we take it all the way to the exact product on sale: brand, model, colourway. Our product-detection stack runs each crop through visual search engines such as Google Lens, corroborates what comes back before naming anything, and matches on pattern and silhouette, no logo needed. The product then links back to every person wearing it.
Read moreRead less
Nothing gets named off a single lookup. A brand classifier proposes candidates, the strongest go out to visual search, and whatever comes back is settled by a rank-weighted vote across all the returns rather than by the top result alone. A second vote of the same kind decides what the item actually is, its category. A separate gate then rules on whether the garment is nameable at all, because most clothing honestly is not: a plain tee has no product identity to find, and a system that always produces an answer is a system that invents them.
We ran a hard test on the standard objection to this layer, which is that studio product photography and 80-pixel social crops sit too far apart for any shared embedding space to bridge. That turns out to be false. A crop from the wild retrieves shop photography of its own garment at recall@1 between 0.87 and 0.90, against a chance rate near 0.01. But when we hand-audited the top hits one at a time, right-kind retrieval came out around 0.76 rather than the 0.90 the automated score implied, because the search engine's own returns include junk that the metric had been counting as success. The mechanism is proven, the accuracy is not yet measured, and we would rather publish that sentence than the flattering number. Five matches in that audit were exactly right, down to an Air Jordan 4 Retro OG and a New Era 9Forty Yankees cap.
03 / What it shows
We know the exact colours New York wears
The New York sample, read off 832 distinct garments rather than off fashion content about New York:
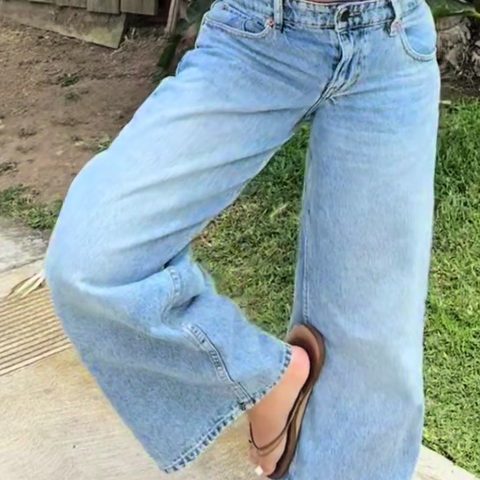
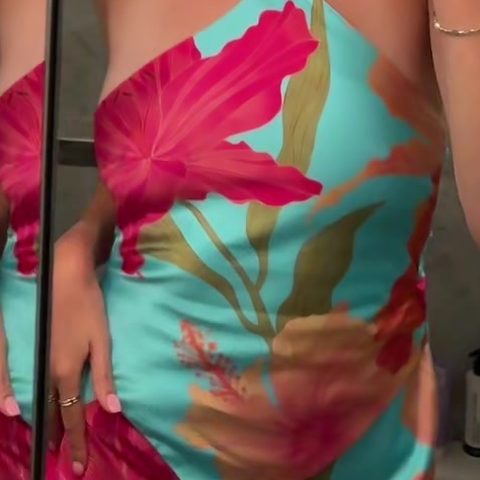
832 distinct garments read off 876 real accounts. The same jacket worn in six posts counts once. More than half of this wardrobe has no colour in it at all, and black alone is nearly a third. This is the brief a brand plans a range against, and every number links back to real people wearing real clothes.
black
white

denim
patterned
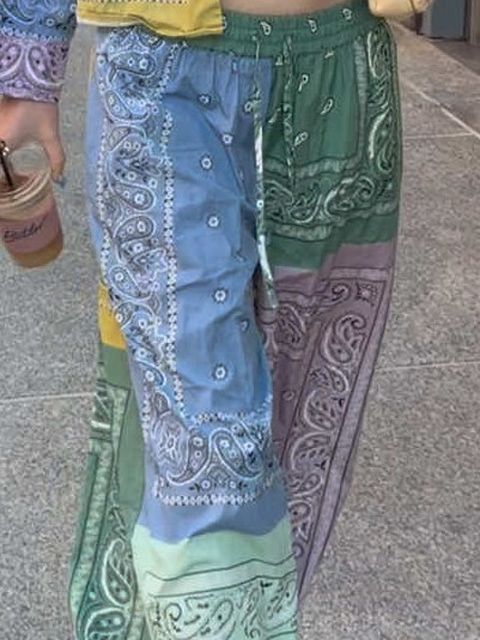
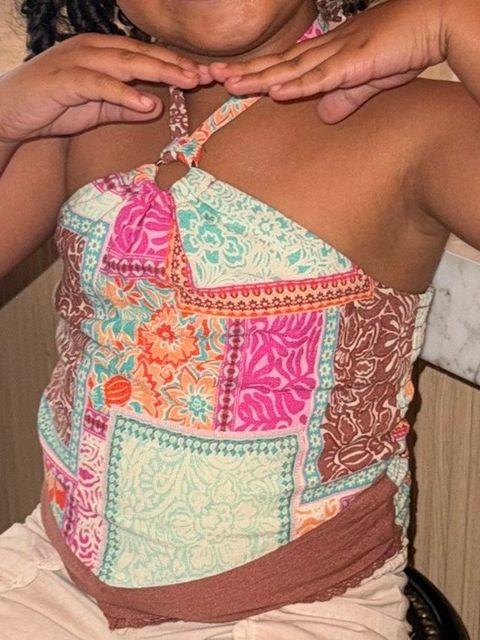
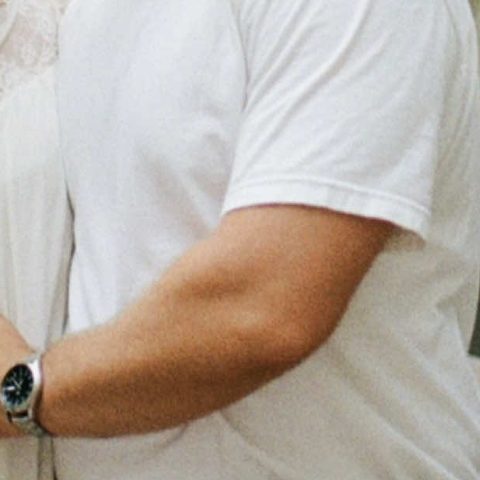
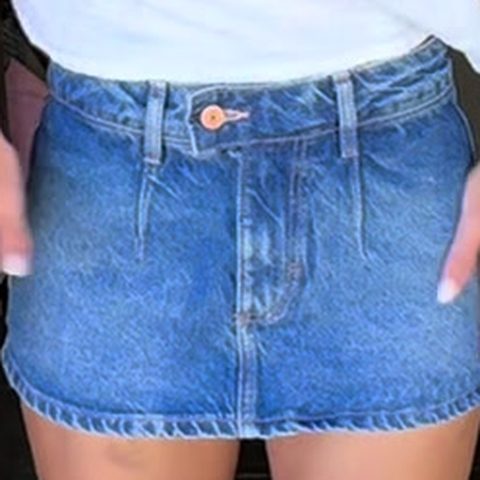
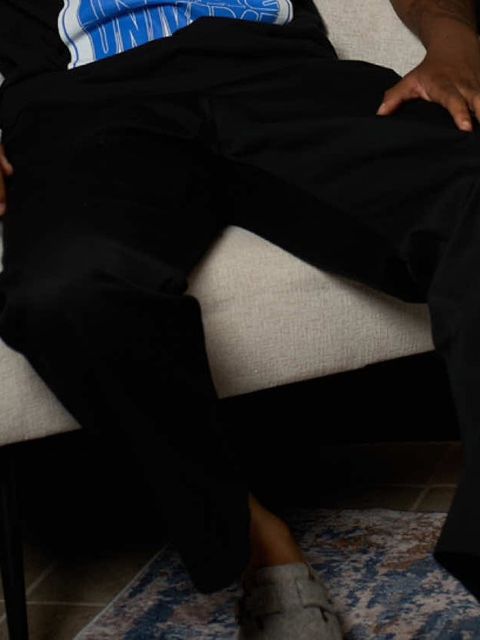
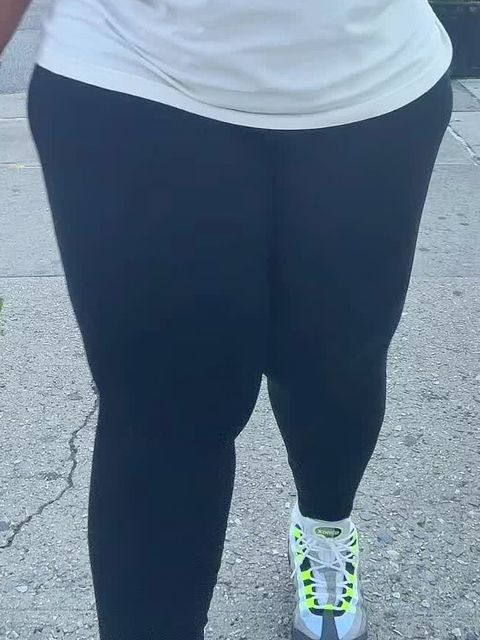
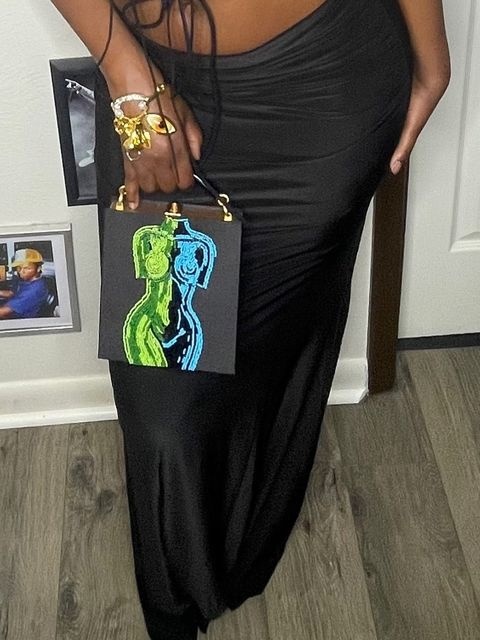
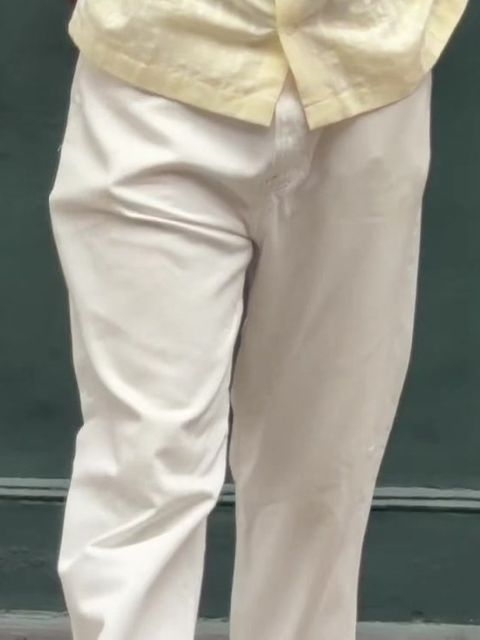
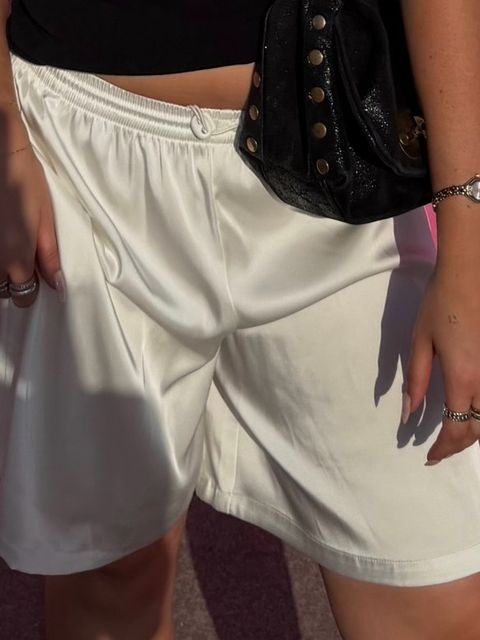
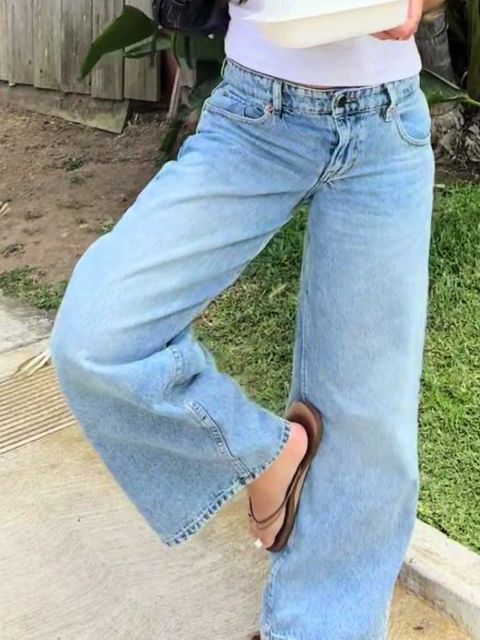
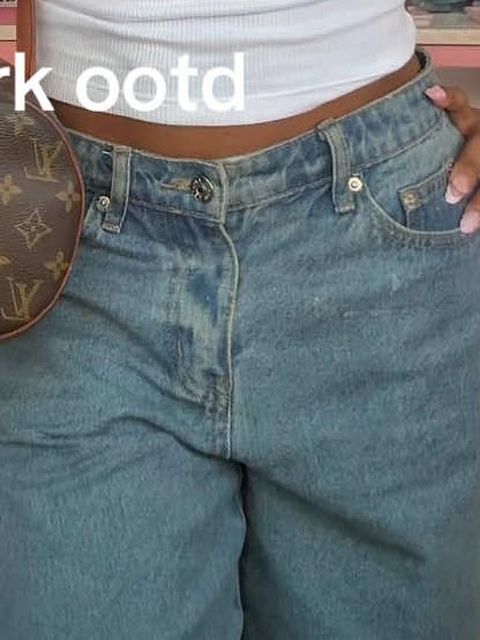
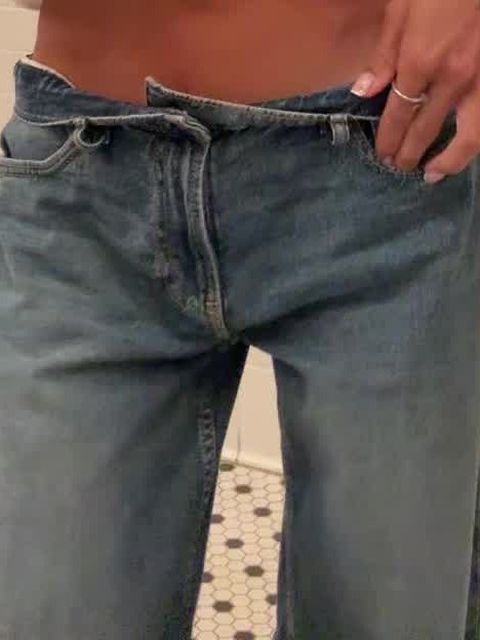
The four biggest colour blocks, three garments each, from the origin-resolution crops behind the numbers. Picked for legibility, not sampled. The bar above is the finding. Faces excluded.
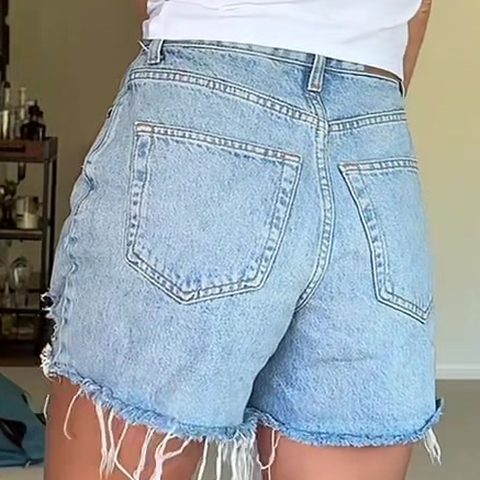
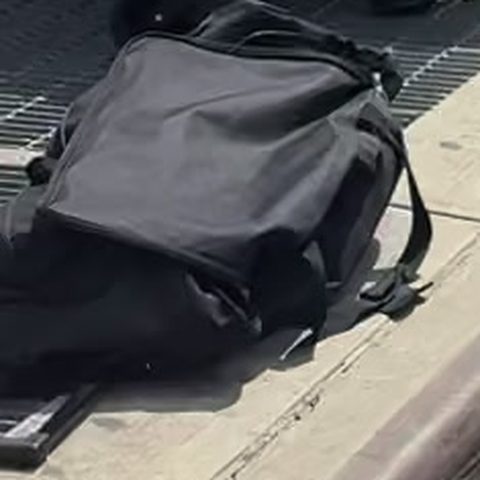
Colour is part of the map, not a guess. Every garment is read for colour as well as form, and the detail is where it pays. Black takes over half of jackets and eyewear, shirts and shoes flip to white, and denim owns exactly one category: pants. Even the black itself is specific: a washed, worn-in near-black, nothing like the flat black of a swatch book. Know an audience's palette at that level, and colourway decisions stop being taste and start being measurement.
That is what the four layers buy, and none of it is specific to New York. Point the same pipeline at any consumer audience and it returns what that audience actually wears: the forms, the colours, the brands and the products, attached to the real people wearing them.
04 / What we are doing now
The work in front of us
One thing in flight, two next, in this order because the substrate has to be right before what runs on it.
05 / Where this goes
The map is the substrate. Agents are what we build on it.
An agent is only as good as what it can look at, and most consumer data cannot support one: unstructured, no evidence attached, error never characterised. Ours is structured at the garment, every entity links back to its frames, and section five is the error. That is what an agent needs to act rather than summarise:
- Compare an audience's observed wear against a brand's live catalogue, in both directions: what to market now because it already exists, and what to make because it does not.
- Track a competitor's share of a real wardrobe over time, measured on bodies rather than from earnings calls.
- Put two audiences side by side, knowing the difference is the audiences and not the method.
And agents are only the first thing the substrate makes possible. The same measured map is what we train our own machine-learning models on: simulations of real communities you can put questions to. How would this audience react to a new colourway? Which of two products would they pick? What do they want that nobody sells yet? Ask the simulation on Monday instead of running a six-week panel. Because the map underneath is measured, every prediction can be scored against reality before we ask anyone to trust it.
Why we think this is hard to copy
Four layers, and each one is useless without the others
Observing an ordinary person wearing a piece of clothing takes all four layers at once: sampling with no list, vision that survives someone filming something else, a representation that describes the garment rather than the photograph, and an accounting of your own bias honest enough to act on. Any one is a project. Together they are infrastructure, and a measured pipeline is one you can improve deliberately, which is the difference between a demo and a system someone runs range planning on.
The offer
Point it at your audience
Bring a city, a segment, or a competitor's customer base. We will build the cohort, read what they wear at garment level, and show you the evidence frames behind every number, including the ones we would rather not show you.
The fine print
Every number on this page comes from a run with a commit hash and a reproduction command, and we measure our own error before anyone else has to: re-running the map with each filter switched off caught a house rule quietly deleting 18% of garments. Two short-term limits, stated plainly: sampling-bias correction is designed but not yet implemented, and the recall census against hand-labelled truth is in progress above.
Related reading: The full New York colour breakdown · How the sampling works · What social listening misses · How fashion brands use AI · Hugo for fashion · Fashion demand forecasting · Predicting what customers will buy